Reducing packaging material is one of the most effective ways to lower material and freight costs, improve efficiency through dimensional weight optimization and help reduce environmental impacts associated with excess material use and distribution.
Beyond Material Reduction to Performance-Based Design
Simply reducing material introduces risk. Without validating performance, thinner cushion designs can lead to higher damage rates, increased returns and added operational and environmental costs.
The challenge is not just using less material; it’s using the right amount to maintain protection.
That’s where cushion curves come into play.
For foam fabricators, cushion curves provide a data-backed method to evaluate whether a material, and more importantly, a specific thickness, can meet real-world distribution demands.
They shift the design question from “Will this material work?” to “What is the minimum material required to meet performance requirements?”
Optimizing Material Usage through Data-Driven Insights
How to Use Cushion Curves
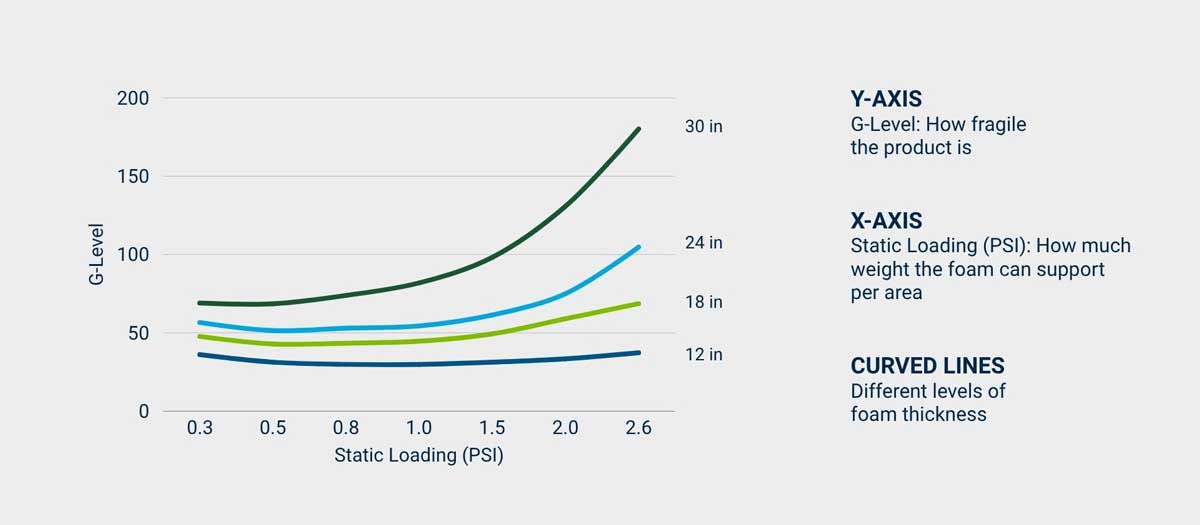
Step 1: Understand the chart
Each graph is specific to the foam type, foam density and drop height.
Cushion curves are generated through controlled drop testing, where foam samples of a given thickness are tested at defined drop heights across a range of static loading conditions. The resulting transmitted shock (G-force) is plotted to show performance. In standardized test protocols, for example ISTA, drop height is assigned based on product weight, with lighter packages tested at higher drop heights to reflect more severe handling conditions.
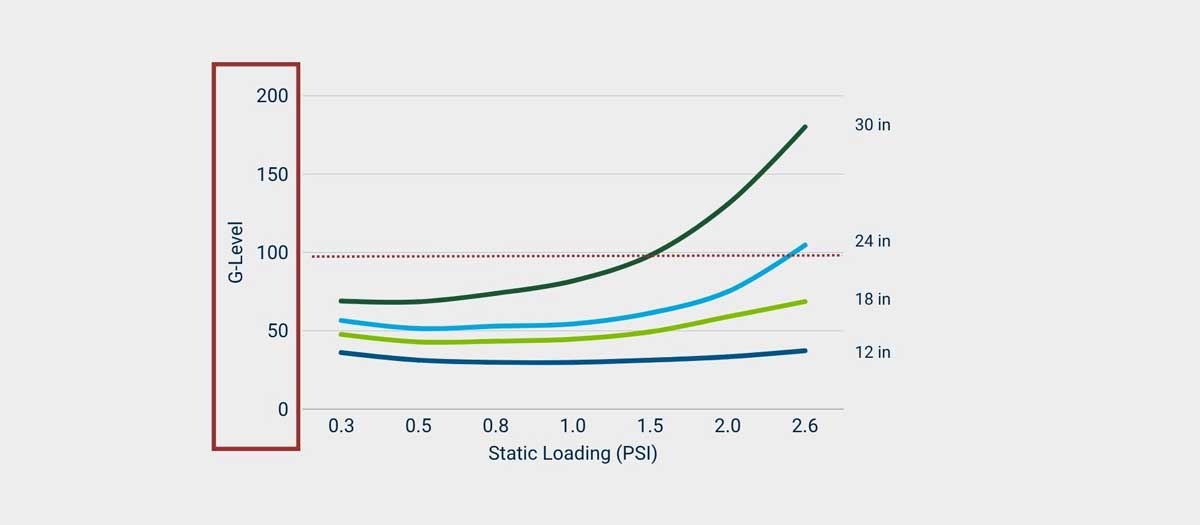
Step 2: Define Product Fragility
Determine how much shock (G-force) your product can withstand without damage. This value sets the maximum allowable shock your packaging must stay below.
Product fragility is established through drop testing, where the product is subjected to controlled drops or standardized testing ranges; the more fragile the product, the lower its G-force rating. For example, an extremely fragile precision instrument may be rated at 20 Gs, while a more durable household product may withstand 100 Gs.
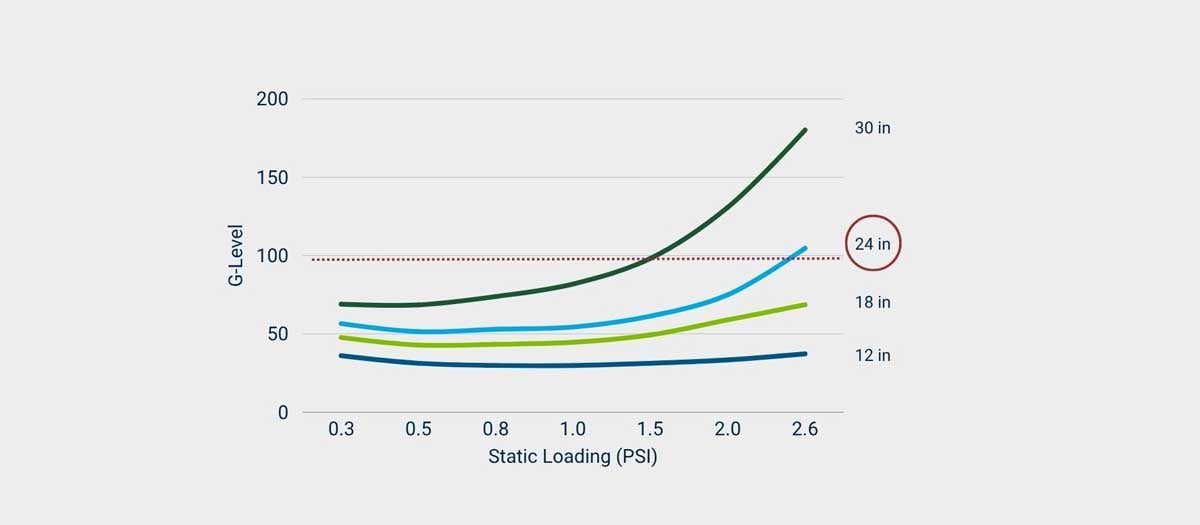
Step 3: Choose Cushion Thickness
Locate the product’s G-value on the chart and draw a horizontal line to find intersecting cushion thickness curves. Choose the thinnest curve intersecting the fragility line to ensure protection with minimal material use.
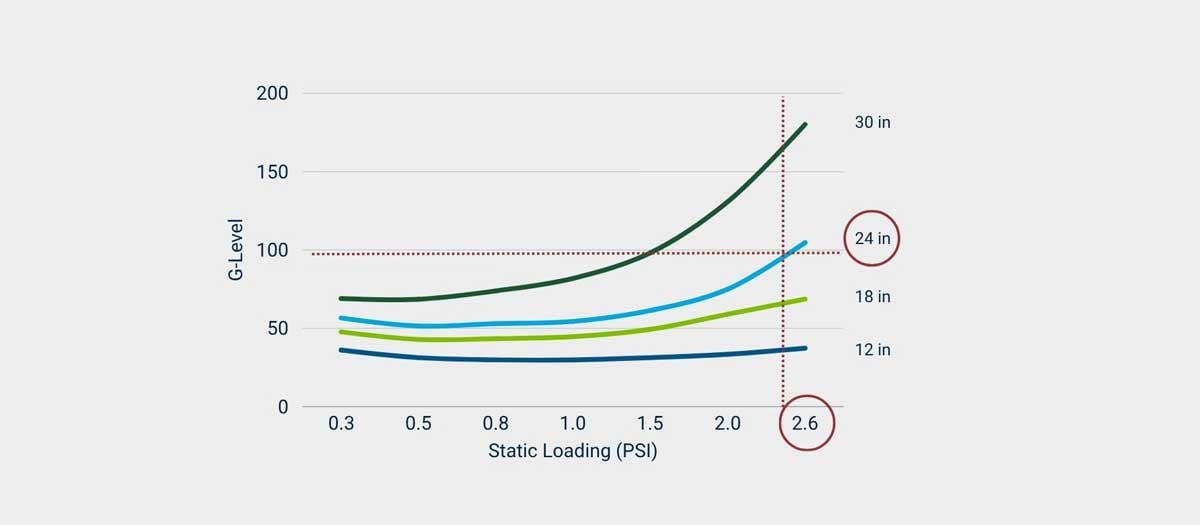
Step 4: Determine the Static Loading
Locate the intersection between the fragility line and cushion thickness curve on the performance chart and draw a vertical line down to the X-Axis. Choose the right-most static loading (psi) value to maximize protection and minimize foam usage for efficient design. Values to the left can be acceptable but increase material usage.
Step 5: Determine Surface Area
Use foam surface area to define plank size or pad dimensions ensuring proper support without excess material. Calculate load-bearing area by dividing product weight by static loading value to determine foam surface needed.
Step 6: Validate Under Real World Distribution Environment
Cushion curves provide a strong starting point, but they are not the final step. Performance should be validated within the full packaging system, where factors like product geometry, pack-out and distribution environment influence real-world outcomes. Distribution testing, including ISTA protocols and capabilities like Pregis IQ, helps confirm that the design performs as intended.
Solutions such as Pregis PolyPlank® Engineered Foam Plank deliver access to cushioning materials supported by performance data, with validation through Pregis IQ testing to confirm performance under real-world conditions.
Ultimately, the goal isn’t simply to reduce material. It’s to apply the right material, in the right way, based on how it actually performs.
Start grounding your designs in data. Get in touch with our team here.
Graphs shown are illustrative examples only and are not representative of any specific application